Traverse Standard v11.0
Sorting and Filtering
There are a number of methods you can use to sort, group, and filter data, from individual columns to report datasets.
Sorting options are available by right-clicking in a column header. Filters work the same way whether you are filtering a report, individual columns, or all columns. Individual columns have an additional autofilter to simplify the most common filtering options.
Arranging, Sorting, and Filtering Columns
Arranging Columns
You can arrange the columns of the view in any desired order to better streamline them for your viewing purposes. To arrange columns, click on the heading of the column to move and drag the heading to the desired location among the other headings.
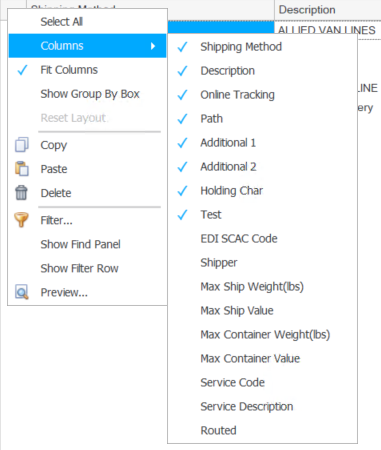
You can hide or show columns in the grid by right-clicking on the upper left corner of the grid and selecting the fields to show or hide from the Columns submenu.
Grouping by Column
You can group entries by identical column information to form expandable groups. To group by columns, click on the heading of the column to group and drag the heading to the Drag a column header here to group by that column section, above the other column headings. For instance, you could group by two columns. For example, your primary group could be Customer PO Number, and your secondary group Order No. This would allow you to expand a Customer PO Number group and view releases grouped by order number.
See examples
Sorting a Column
When you define IDs and codes, it is important for you to know how they appear in a field list after they are sorted. Traverse sorts alphanumeric data alphabetically by comparing first characters, then second characters, and so forth. When two alphanumeric characters are compared, the character with the smaller ASCII value comes first in the alphabetic sort.
The list of alphanumeric characters is in ascending alphabetic order:
- Special characters (-, *, /, and so forth)
- Numbers (0-9)
- Uppercase letters (A-Z)
- Lowercase letters (a-z)
Alphabetical rules are not intuitive when numbers are involved. For example, in numerical sorting 60 comes before 112; however, in alphabetical sorting 112 comes before 60. To ensure that numbers appear in the same order in both an alphabetic and numeric sort, pad numbers to the left with zeros until they are the same length. For example, if 60 is defined as 060, 060 comes before 112 in both an alphabetic and a numeric sort.
| Sort | By |
| Ascending | Clicking the column heading until the  appears appears |
| Descending | Clicking the column heading until the  appears appears |
You can sort columns to group and filter the data. To sort and filter the columns, right-click a column and use the functions outlined in the table below.
| Button | Name | Select To |
|---|---|---|

|
Sort Ascending | Sort the selected column's data in ascending order. Note: You can also accomplish this task by clicking the column heading until the appears. |

|
Sort Descending | Sort the selected column's data in descending order. Note: You can also accomplish this task by clicking the column heading until the appears. |
| Clear Sorting | Remove all sorting options and revert to the default view. | |

|
Group By This Column | Group the identical entries from this column into a single group. Note: If you group by column entry, you can right-click on the grouped column heading to select from the options outlined in this table as well as Full Expand (expand all of the grouped entries), Full Collapse (collapse all of the grouped entries), or UnGroup (undo the grouped entry). |

|
Column Chooser | Open the Customization window. Proceed to click and drag columns from this window to place them back into the table. Note: You can also accomplish this task by clicking on the heading of the column to remove and drag the heading to the bottom of the screen and release once your cursor changes to a large 'X'. |

|
Best Fit | Adjust the selected column to best view that column's data. |
|
|
Clear Filter | Remove all filter options and revert to the default view. |

|
Filter Editor | See the Filtering Across All Columns section for more information. |
| Show Filter Row | Adds a row at the top of the data where filter criteria can be entered. This can be easier than using the little filter (funnel) icon in the column header to enter filter criteria. | |
| Best Fit (all columns) | Adjust all columns to best view all of the data at once. |
Filtering by an Individual Column
- Click the funnel icon that appears once you place the cursor in the desired column to filter.
- Select a filter option from the drop-down menu.
Note: From this drop-down list, you can also select from the entries in the selected column to group the column by the selected entry.
| Select | To |
|---|---|
| (Custom) | Enter criteria for filtering the selected column. Note: View the following paragraph for additional information. |
| (Blanks) | Display only entries with blank information in the selected column. |
| (Non blanks) | Display only entries with information in the selected column. |
| Note: If you select (Custom), the Custom AutoFilter function appears. Select up to two filtering criteria for the selected column from the drop-down menus, then enter a string of text or numbers to complete the condition before clicking OK. | |
Filtering Across All Columns
To create a filter across all columns, use the Filter Editor function to create a filtering condition. A filter condition can consist of up to four options. Each option within the condition appears as a different color to help distinguish it from the other options, Red Text [Blue Text]Green Text<gray text>. The instructions below illustrate how to build a condition. See Conditional Basics for more details.
- Select how to group values by clicking the red text component (See Table 1).
- Select a column heading to filter by clicking the blue text component.
- Select the filtering criterion by clicking the green text component (See Table 2).
- Enter, if applicable, a string of text or numbers to complete the condition by clicking the gray text component.
- Click Apply.
- Click OK.
| Button | Name |

|
And |

|
Or |

|
Not And |

|
Not Or |

|
Add Condition |

|
Add Group |
|
|
Clear All |
| Table 1 - Red Component | |
| Button | Name |

|
Equals |

|
Does not equal |

|
Is greater than |

|
Is greater than or equal to |

|
Is less than |

|
Is less than or equal to |

|
Is between |

|
Is not between |

|
Contains |

|
Does not contain |

|
Begins with |

|
Ends with |

|
Is like |

|
Is not like |
|
|
Is blank |
|
|
Is not blank |

|
Is any of |

|
Is none of |
| Table 2 - Green Component | |
After arranging, sorting, and filtering the columns how you want to view the information:
Use the Preview Report button to view a preview of the information as a report. To print the report, click the Print button or to export the report to a PDF, HTML, MHT, RTF, Excel, CSV, Text, or Image File, click the Export Document button.
Use the Export Data button to export and save the data as an HTML, XML, plain text, or Microsoft Excel document.
Note: Depending on the output type selected, the information may export exactly as it appears on the screen, including column widths and expanded or collapsed grouped entries.
Use the Views button to save the current parameters set for the interactive view for using at a later time. You can also use the button to select, edit, or delete from the multiple saved views.
Use the Reset Layout button to reset the column headings and any sorting changes made to the information table.
See the Interactive View Overview for a basic understanding of interactive views and to view movies outlining the different types of interactive views.
Data Filters
Use the Data Filter from report pick screens to build a condition to filter the generated report. A filter condition can consist of up to four options. Each option within the condition appears as a different color help distinguish it from the other options, Black Text [Blue Text]Green Text<gray text>. The instructions below illustrate how to build a condition. See Conditional Basics for more details.
- Select how to group values by clicking the black text component (See Table 1).
- Select a column heading to filter by clicking the blue text component .
- Select the filtering criterion by clicking the green text component (See Table 2).
- Enter, if applicable, a string of text or numbers to complete the condition by clicking the gray text component.
- Click the
 icon to add additional conditions if applicable.
 - Use the Print, Preview, or Reset buttons to generate the report or set all fields to their default values.
| Button | Name |
|
|
And |
|
|
Or |
|
|
Not And |
|
|
Not Or |
|
|
Add Condition |
|
|
Add Group |
|
|
Clear All |
| Table 1 - Black Component | |
| Button | Name |
|
|
Equals |
|
|
Does not equal |
|
|
Is greater than |
|
|
Is greater than or equal to |
|
|
Is less than |
|
|
Is less than or equal to |
|
|
Is between |
|
|
Is not between |
|
|
Contains |
|
|
Does not contain |
|
|
Begins with |
|
|
Ends with |
|
|
Is like |
|
|
Is not like |
|
|
Is blank |
|
|
Is not blank |
|
|
Is any of |
|
|
Is none of |
| Table 2 - Green Component | |
Conditional Basics
Use conditional statements to determine the data you can see in the view. There are four conditionals available to you for your interactive view or report:
AND
The AND conditional requires all records to match all conditions you set. If you set conditions that contradict each other, such as “City begins with P AND City begins with R”, your view will have no results, because a city cannot begin with both P and R at the same time.
If you set conditions that can exist at the same time, you will get results from your filter. For example, this filter: “City begins with P AND City ends with E”, will include records for Phoenixville, Pine Grove, and Pipersville, but not Philadelphia, Paoli, or Adamsville.
OR
The OR conditional requires all records to match only one of the conditions you set. If you set conditions that contradict each other, such as “City begins with P OR City begins with R”, your view will have results that include only cities that begin with either P or R.
For example, this filter: “City begins with P OR City ends with E”, will include records for Phoenixville, Bernville, Crum Lynne, Philadelphia, Paoli, and Adamsville, but not Bryn Mawr or Appleton.
NOT AND
The NOT AND conditional requires all records to not match all conditions you set. If you set conditions that contradict each other, such as “City begins with P NOT AND City begins with R”, your view will have the same results as only setting the condition of “City begins with P”, because a city cannot begin with both P and R at the same time anyway.
The conditions you set will eliminate all records that meet both conditions. For example, this filter: “City begins with P NOT AND City ends with E”, will include records for Philadelphia, Appleton, Osceola, and New Prague, but not Phoenixville, Pine Grove, or Pipersville.
NOT OR
The NOT OR conditional requires all records to not match any conditions you set. This is an elimination conditional that will exclude any records that match any of the conditions you set.
For example, this filter: “City begins with P NOT OR City ends with E”, will include records for Appleton, Osceola, and Bryn Mawr, but not Phoenixville, New Prague, Philadelphia, or Bernville.